Making sense of business data so that you can get value out of it is worthwhile yet still challenging. Even though the term Business Intelligence (BI) has been around since the mid-1800s (according to Wikipedia) adoption of contemporary BI tools within enterprises is still fairly low.
Amazon QuickSight was designed to make it easier for you to put BI to work in your organization. Announced in 2015 and launched in 2016, QuickSight is a scalable BI service built for the cloud. Since that 2016 launch, we have added many new features, including geospatial visualization and private VPC access in 2017, pay-per-session pricing in 2018, additional APIs (data, dashboard, SPICE, and permissions in 2019), embedded authoring of dashboards & support for auto-naratives in 2020, and Dataset-as-a-Source in 2021.
QuickSight Q is Here
My colleague Harunobu Kameda announced Amazon QuickSight Q (or Q for short) last December and gave you a sneak peek. Today I am happy to announce the general availability of Q, and would like to show you how it works!
 To recap, Q is a natural language query tool for the Enterprise Edition of QuickSight. Powered by machine learning, it makes your existing data more accessible, and therefore more valuable. Think of Q as your personal Business Intelligence Engineer or Data Analyst, one that is on call 24 hours a day and always ready to provide you with quick, meaningful results! You get high-quality results in seconds, always shown in an appropriate form.
Behind the scenes, Q uses Natural Language Understanding (NLU) to discover the intent of your question. Aided by models that have been trained to recognize vocabulary and concepts drawn from multiple domains (sales, marketing, retail, HR, advertising, financial services, health care, and so forth), Q is able to answer questions that refer all data sources supported by QuickSight. This includes data from AWS sources such as Amazon Redshift, Amazon Relational Database Service (RDS), Amazon Aurora, Amazon Athena, and Amazon Simple Storage Service (Amazon S3) as well as third party sources & SaaS apps such as Salesforce, Adobe Analytics, ServiceNow, and Excel.
Q in Action
Q is powered by topics, which are generally created by QuickSight Authors for use within an organization (if you are a QuickSight Author, you can learn more about getting started). Topics represent subject areas for questions, and are created interactively. To learn more about the five-step process that Authors use to create a topic, be sure to watch our new video, Tips to Create a Great Q Topic.
To use Q, I simply select a topic (B2B Sales in this case) and enter a question in the Q bar at the top of the page:
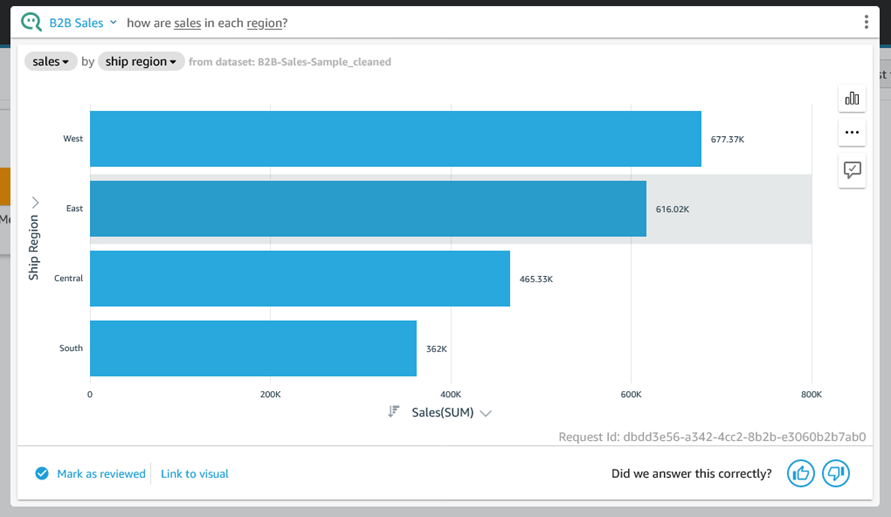
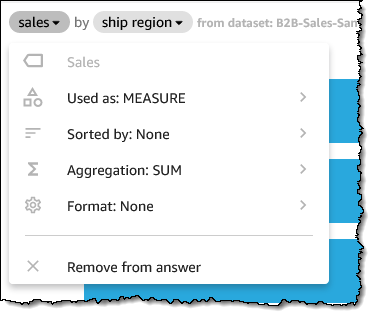
In addition to the actual results, Q gives me access to explanatory information that I can review to ensure that my question was understood and processed as desired. For example, I can click on sales and learn how Q handles the field:
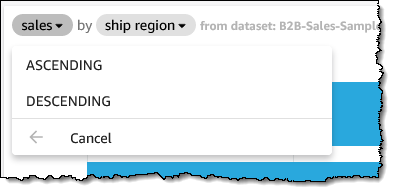
I can fine-tune each aspect as well; here I clicked Sorted by:
Q chooses an appropriate visual representation for each answer, but I can fine-tune that as well:
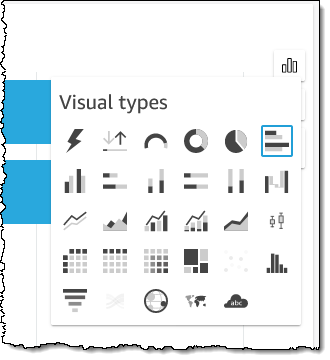
Perhaps I want a donut chart instead:
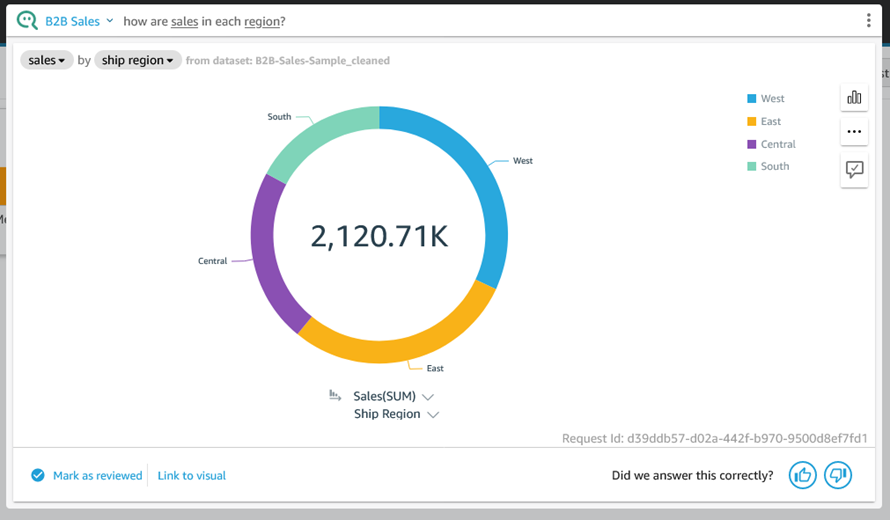
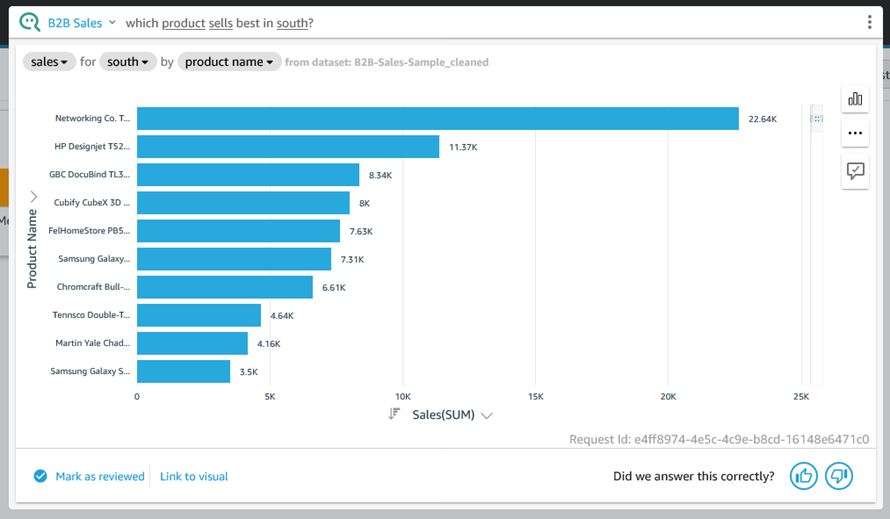
Now that you have seen how Q processes a question and gives you control over how the question is processed & displayed, let’s take a look at a few more questions, starting with “which product sells best in south?”
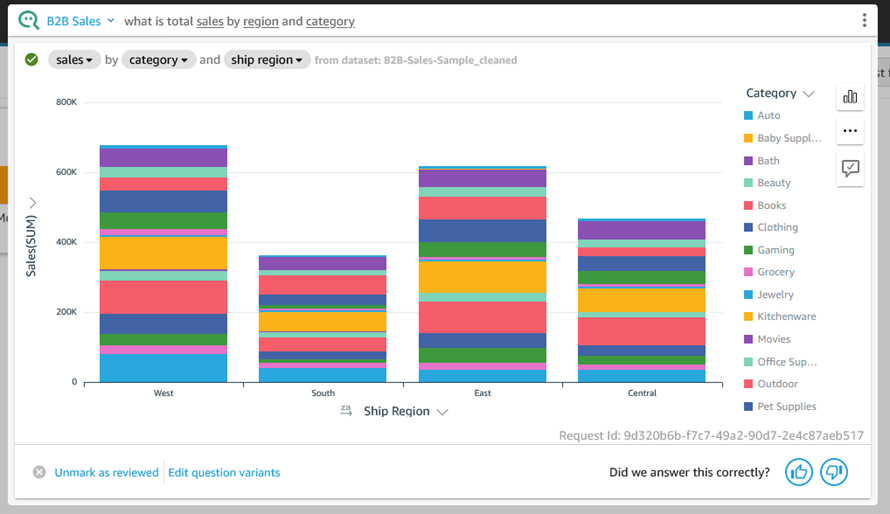
Here’s “what is total sales by region and category?” using the vertical stacked bar chart visual:
Behind the Scenes – Q Topics
As I mentioned earlier, Q uses topics to represent a particular subject matter. I click Topics to see the list of topics that I have created or that have been shared with me:
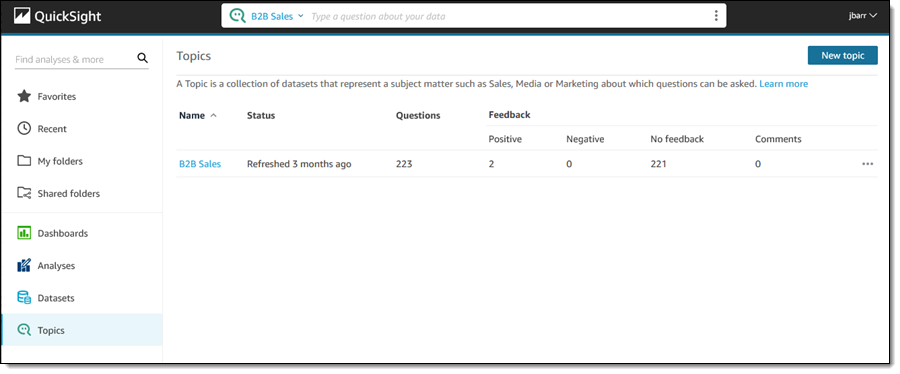
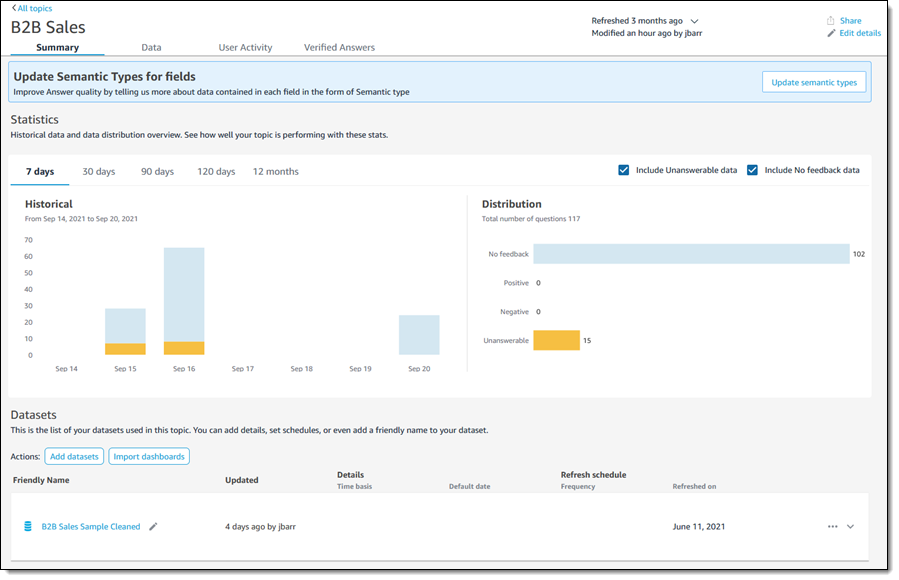
I click B2B Sales to learn more. The Summary page is designed to provide QuickSight Authors with information that they can use to fine-tune the topic:
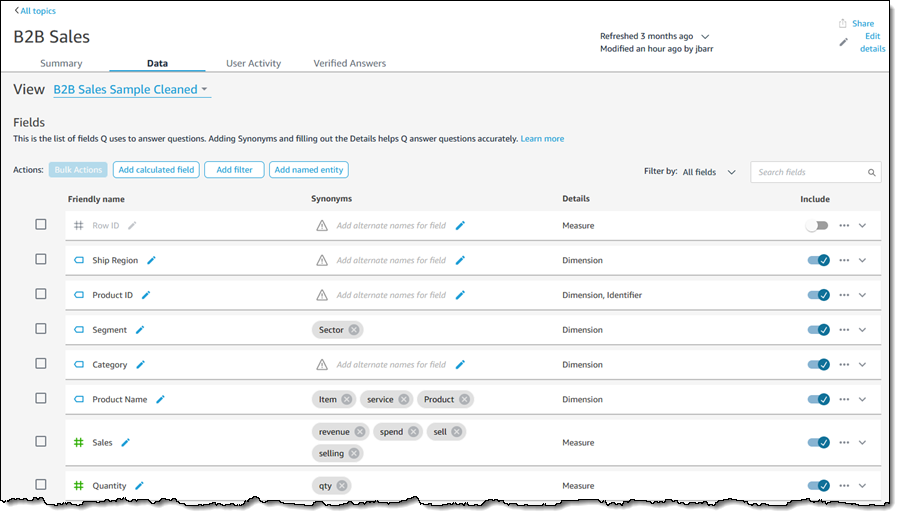
I can click on the Data tab and learn more about the list of fields that Q uses to answer questions. Each field can have some synonyms or friendly names to make the process of asking questions simpler and more natural:
I can expand a field (row) to learn more about how Q “understands” and uses the field. I can make changes in order to exercise control over the types of aggregations that make sense for the field, and I can also provide additional semantic information:
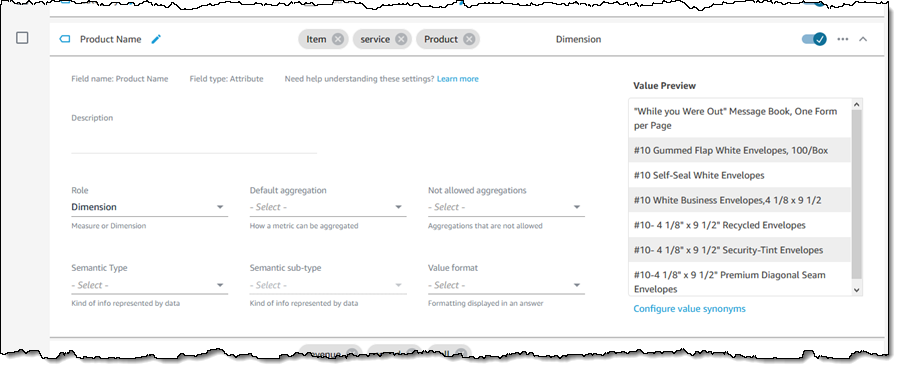
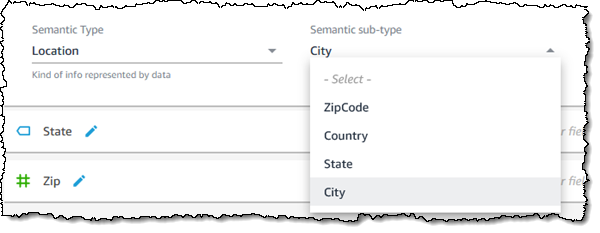
As an example of providing additional semantic information, if the field’s Semantic Type is Location, I can choose the appropriate sub-type:
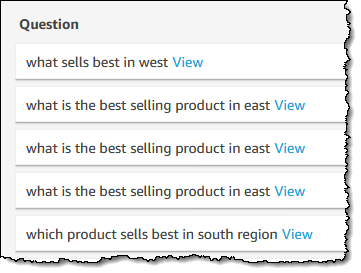
The User Activity tab shows me the questions that users are asking of this topic:
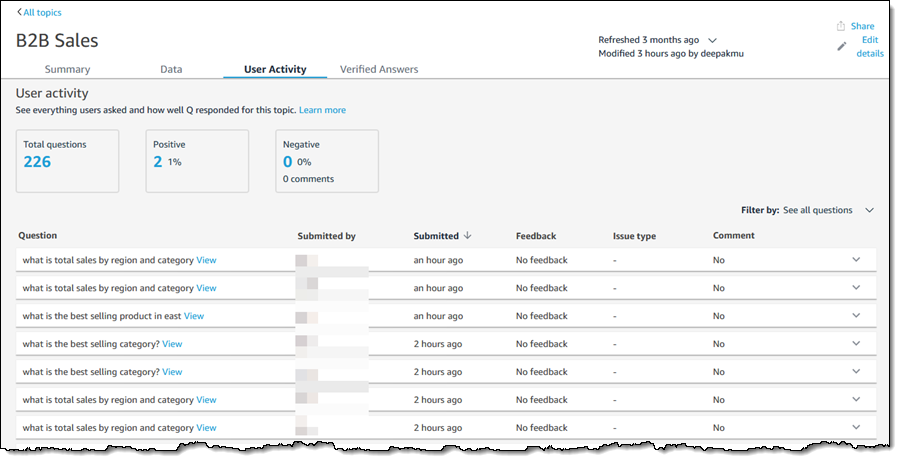
QuickSight Authors can use this tab to monitor user feedback, get a sense of the most common questions, and also use the common questions to drive improvements to the content provided on QuickSight dashboards.
Finally, the Verified answers tab shows the answers that have been manually reviewed and approved:

Things to Know
Here are a couple of things to know about Amazon QuickSight Q:
Pricing – There’s a monthly fee for each Reader and each Author; take a look at the QuickSight Pricing Page for more information.
Regions – Q is available in the US East (N. Virginia), US West (Oregon), US East (Ohio), Europe (Ireland), Europe (Frankfurt), and Europe (London) Regions.
Supported Languages – We are launching with question support in English.
— Jeff;
