The Ultimate Showdown of Ultimate Destiny now has an extended version with all-new improved animation from a variety of online animators.
… and you say you don’t know what’s going on in Second-level cache!!
Here it is..
Terracotta 3.1 just got released!! The developer console that comes with this release is … just awesome!! If you use hibernate and second-level cache… and you had been wondering what’s actually going on in your second-level cache.. how many hits, misses, puts… and all those statistical information that you need for your app… those days are over.. well at least if you are using Terracotta 🙂 !! The new console gives you total visibility of your second-level cache…
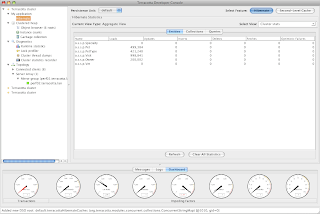
When you open up the dev-console, a new “node” with the name “Hibernate” comes up in the left side tree view of the developer console (when you use second-level cache backed by Terracotta, of course). There you have two views/tabs.. “Hibernate” and “Second level Cache” (the two buttons on top right hand side, as of this release). Hibernate tab gives you stats like how many loads/updates/inserts/deletes etc of your domain entities and collections have happened etc. If you go over to the “Second-level Cache” view, there are tons of other information there. There are 3 sub-views here.. Overview, Statistics and Configuration.
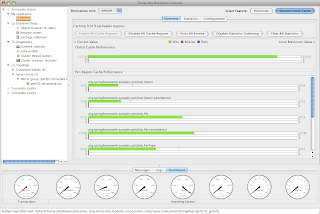
Overview shows you how much hits/misses/puts are happening in your cache .. globally (all your cache regions) and per region-wise too. The cool part is that it is real-time.. the picture below might not show it, but its a real-time histogram…
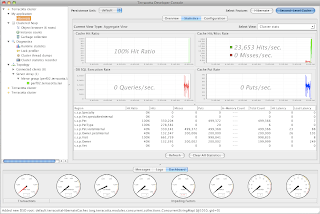
In the Statistics panel, you’ve got 4 charts showing the cache hit ratio, # of cache hit/miss per sec, the # of sql queries happening (this is different from the actual number of queries you get from hibernate statistics, which gives only count of HQL), and the rate at which puts are happening. So if you had ever been wondering if your second-level cache is actually working or not, you can now *prove* its working — you should see 100% cache hit ratio, no cache misses happening, no queries going to the DB etc. And of course, if these values are not what you expect you should go back and look what’s actually going on in your app… the point is you get all those info that you had been wishing for!! isnt’ tht sweet… 🙂
Also you can view # hits, # misses, hit ratio etc region wise… which is like the best visibility you can get for your second level cache!! 🙂
You’ll have to try out the new dev-console to see what’s actually in store for you…
Check out some of these screenshots…


