Venture-backed fintechs raised a record $30.8 billion in the second quarter of this year, up 30% over the same quarter last year. And they’re raising more, and faster, than ever — the average deal size stands at $47 million this year.
So, with fintech founders now sitting on mountains of cash as a result, just how are they spending it all?
Unfortunately, data across private and public companies generally doesn’t show discernible trends in how these dollars are spent. That said, perhaps some answers to the question of how well capital can be allocated are hiding in plain sight.
Looking to the leaders
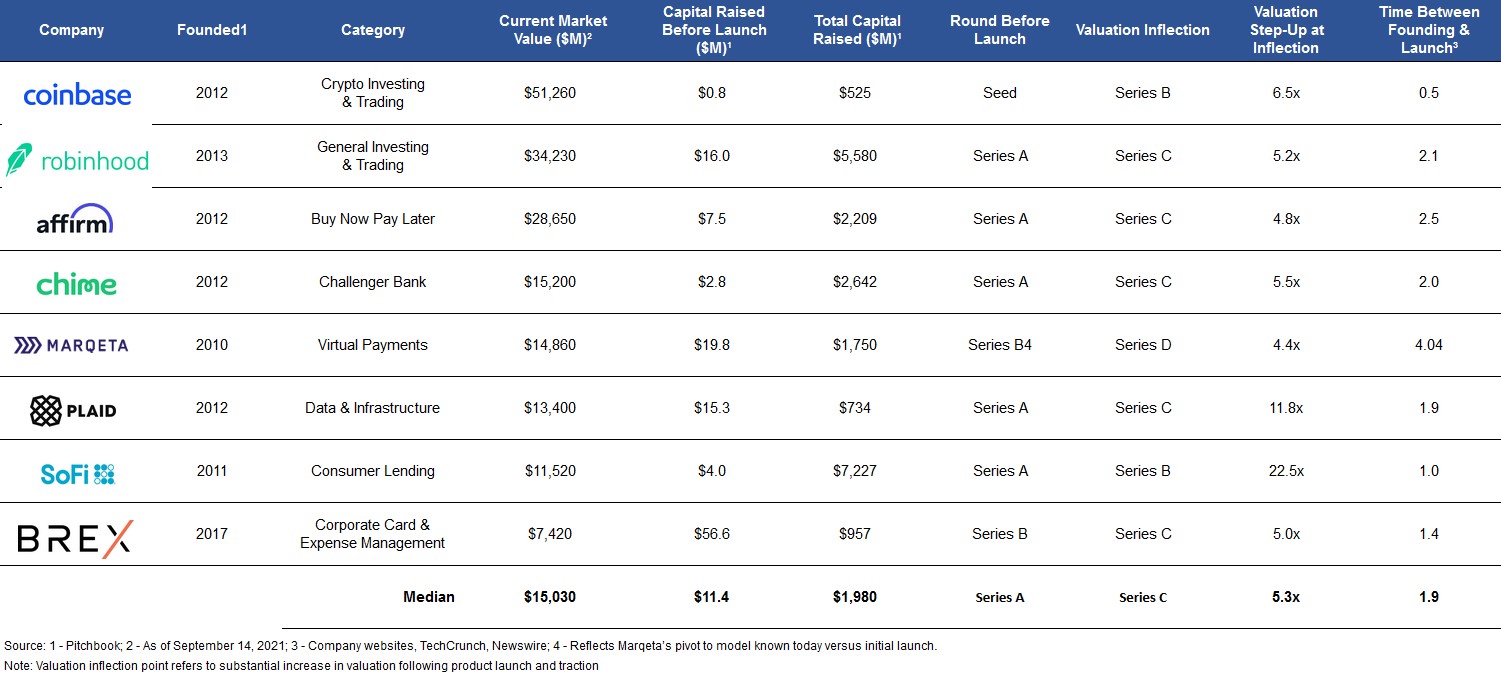
There are now a slew of fintech startups approaching or far surpassing $10 billion in value — the table below has a selection of the most prominent — so we can glean some insight into their capital allocation strategies by considering how they have spent to achieve their position in the ecosystem. Some may argue that the differences in business models among these companies, their disparate markets, and studying a ten-year span of capital raising might make it challenging to extract any relevant insights. But their fundraising and business building behaviors indicate otherwise.
Studying this selection of fintech “leaders” can give us core takeaways on how they have funded and built their businesses. Most of these companies built their business over the course of two years before launching their product and scaling rapidly with limited capital, sometimes even before a Series A — quite a departure from what’s happening in today’s fundraising environment.
Many of these companies nurtured early champions of their product in both customers and distribution partners, which allowed them to grow and scale without needing to sell to enterprises. All of them eventually raised monster rounds — at an astounding 174x multiple of the capital raised before launch — but they waited to do so until after their product had already been adopted by the market.

Fundraising and launch trends among select leaders in fintech. Image Credits: Dave Mullen
All of these businesses share three common traits.
A valuation inflection point
Despite having different business models, end markets, and being founded at different times, this sample showed a consistent valuation inflection point. Generally, these companies launched their product just after the Series A, used their Series B to pour fuel on the fire, and then hit a 5x valuation uptick at the Series C.
